Part 5 of the series "Smart Home in Practice". Part 3 connected the heat pump via Modbus, Part 4 identified the registers. Now comes the reward: values the vendor app never showed - and what they mean.
The vendor app showed three things for my heat pump: setpoints, operating mode, occasionally a consumption figure of doubtful accuracy. The local Modbus access from Part 3 delivers the engine room instead: refrigerant circuit pressures, suction gas temperature, the compressor's apparent power. That sounds like numbers for professionals - but it is not. With a single physical relationship, they turn into key figures from which lay people too can read wear, refrigerant loss and creeping efficiency losses, before a service company diagnoses them expensively.
The refrigerant circuit, this time with numbers
The short model from Part 2 - a fridge running backwards - now gets measuring points. The refrigerant R290 (propane) passes four stations, and at each it has a characteristic pressure and temperature:
- Evaporator (outside): liquid refrigerant evaporates at low pressure and absorbs heat from the air. This is where the low pressure lives.
- Compressor: squeezes the gas. Pressure and temperature rise, the electricity meter spins.
- Condenser (inside): the hot gas hands its heat to the heating water and condenses. This is where the high pressure lives.
- Expansion valve: relaxes the liquid refrigerant back to low pressure - and everything starts over.
The unit delivers both pressures as raw numbers. They become interesting through a property every pure refrigerant has.
The vapour pressure curve: a thermometer made of pressure
For a pure refrigerant, every pressure corresponds to exactly one boiling temperature - that is the vapour pressure curve. For propane it is tabulated: 6 bar mean a boiling point of roughly 14 degrees, 18 bar roughly 55, 23 bar roughly 67. Knowing the pressure means knowing the temperature at which the refrigerant is currently evaporating or condensing. Two pressure registers thus become two new readings no sensor on the unit provides directly: the evaporation temperature and the condensation temperature.
As a side effect, this curve was also the proof for the register mapping in Part 4: across a complete hot water run, the condensation temperature computed from the high pressure matched the independently measured flow temperature to within one and a half kelvin - tracking monotonically across seven measuring points, from 55 to 67 degrees. Two registers that deliver such values by coincidence do not exist.
Superheat: the one number that watches the refrigerant circuit
Now it pays off. The unit measures the suction gas temperature - the gas temperature just before the compressor. Subtract the evaporation temperature and you get the superheat: how many kelvin the gas sits above its boiling point.
Why this is the most important diagnostic number of the refrigerant circuit:
- Too low (towards zero): liquid refrigerant could reach the compressor - which it does not tolerate; professionals call it liquid slugging.
- Too high (persistently rising): the classic early sign of refrigerant loss. The unit still heats, but worse - often unnoticed for months.
- Stable in the design range: all is well.
My unit holds a steady 5 to 8 kelvin in operation - an unremarkable, healthy value. The point is: this value simply did not exist before. No app, no control panel menu shows it. Now it is one line on the dashboard, and a creeping drift over weeks would stand out long before the heating output noticeably drops.
Following the same pattern, more derived values appear, all without additional sensors: the temperature lift (condensation minus evaporation temperature - the smaller, the more efficiently the unit works), the compression ratio, and as a theoretical yardstick the Carnot efficiency, the physical upper bound of what would be possible at these temperatures at all.
Honesty about power: apparent is not real
One damper belongs in here. The unit reports its electrical power - but comparison with an external three-phase meter showed: it is the apparent power, not the real power. The ratio to externally measured apparent power stayed constant across a complete hot water run, the ratio to real power did not - and the power factor rose with load from 0.71 to 0.79, as you would expect from an inverter compressor. At standstill, the internal value additionally parks on a fixed number for hours while the real meter sees something else.
The consequence for anyone rebuilding this: if you want to know what the unit really consumes, measure externally - a meter with a local API in the supply circuit is enough. The internal value remains useful all the same: as a load indicator and a compressor state signal.
Key figures instead of gut feeling: energy per heating degree day
The supreme discipline would be the coefficient of performance - heat produced divided by electricity consumed. For that, of all things, this unit lacks the flow rate over Modbus, and without volume flow there is no heat quantity. Rather than guess, the dashboard works with two honest substitutes:
- Consumption per kelvin of tank lift for hot water: how many watt hours does it take to raise the tank by one kelvin? The tank volume is constant, so the number is comparable over time - if it deteriorates, something is wrong.
- Electricity per heating degree day for heating: heating degree days measure how cold a day was (the colder, the more of them). Dividing heat pump electricity by heating degree days makes cold and mild days comparable - if the weekly average falls, the unit is working more efficiently.
This is what the underlying data looks like in daily life - a hot water run and its afterlife, recorded over the local bus:
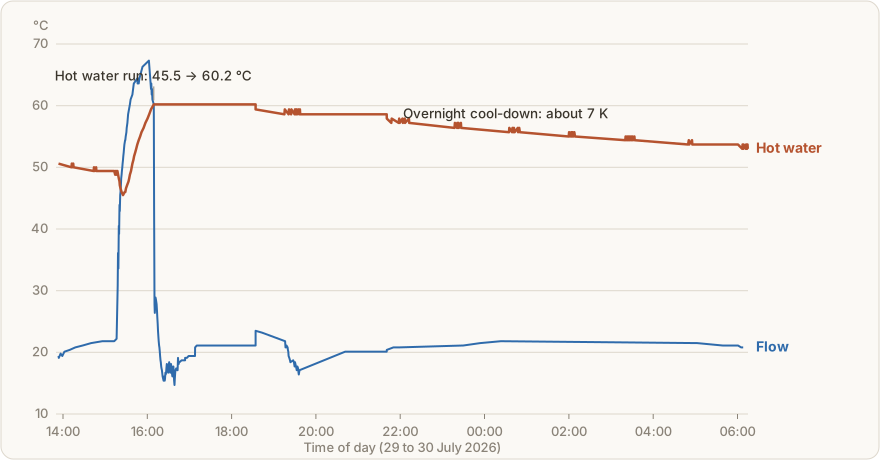
The run lifts the tank by 15 kelvin in just under an hour, after which it loses about 7 kelvin until morning. That too is a number that did not exist before: the standing losses of your own tank, measured instead of estimated.
On the second figure rests a tuning rule that has proven itself and that I pass on here in full, because it fits any heat pump: the heating curve is lowered by one kelvin only if the weekly average efficiency has deteriorated and no room dropped below its target temperature in the coldest night. If a room does drop below: one kelvin back immediately, and stay there. And: change only one variable per week, otherwise you never know what worked. The comfort veto is the important part - efficiency the household has to suffer for does not survive a winter.
Watching for wear: cycling
The quiet enemy of every heat pump is short cycling: the compressor starts, runs a few minutes, stops - and every start costs lifetime. From the power signal, the firmware counts compressor starts per day, average and shortest run time, and operating hours. If short cycling piles up, that is a prompt to look at the heating curve or hysteresis - long before it wears out the machine.
The dashboard code
All values described here come ready-made from the firmware in the repository; a complete Lovelace dashboard with operation, refrigerant circuit, power, wear and bus health ships there as YAML. Three cards from it with the most everyday value - the entity prefixes follow the device name from Part 3:
# Flow and return: the breathing of the machine
- type: history-graph
  title: Water temperatures
  hours_to_show: 2
  entities:
    - entity: sensor.heizungskeller_warmepumpe_modbus_wasser_vorlauftemperatur
    - entity: sensor.heizungskeller_warmepumpe_modbus_wasser_rucklauftemperatur

# Refrigerant circuit: superheat and both pressures
- type: history-graph
  title: Refrigerant circuit
  hours_to_show: 24
  entities:
    - entity: sensor.heizungskeller_warmepumpe_modbus_sauggasuberhitzung
    - entity: sensor.heizungskeller_warmepumpe_modbus_ir21_hochdruck
    - entity: sensor.heizungskeller_warmepumpe_modbus_ir22_niederdruck

# Flow versus outdoor temperature: shows whether the heating curve fits
- type: history-graph
  title: Flow vs. outdoor temperature
  hours_to_show: 48
  entities:
    - entity: sensor.heizungskeller_warmepumpe_modbus_wasser_vorlauftemperatur
      name: Flow
    - entity: sensor.heizungskeller_warmepumpe_modbus_aussentemperatur
      name: Outdoor
Outlook: from watching to steering
Reading and understanding are solved - and by now, so is actuation: the connection writes the hot water enable, the setpoints, the operating mode and silent mode, all confirmed over the bus. In Home Assistant the heat pump thus appears as a fully-fledged climate entity, ready to be wired to an energy manager. SG-Ready nevertheless stays on the plan: two switching inputs through which an energy manager gives the unit standardised operating recommendations - a robust, vendor-neutral complement to the bus. That will be a project of its own - and probably a post of its own.
With that, the heat pump block of this series is complete: from the failed cloud via wiring and register hunting to diagnostics. Part 6 pulls the threads together: a home-grown energy management that knows batteries, hot water and the heat pump as roles.
Sources
- GitHub: lg-therma-v-esphome-modbus - firmware with all computed diagnostics and the full dashboard
- NIST: Thermophysical Properties of Propane (WebBook) - property data behind the R290 vapour pressure curve
- Home Assistant: History Graph Card - documentation of the card type used
- German Heat Pump Association: SG Ready (German) - the standardised interface for the next step